
In our last post, we tried to explain the Indian Premier League market using data from Google Trends. It turns out that Google Trends may also be used to get some idea about the box office performance of movies.
As is explained in the last post, Google Trends gives us the Google search index of a particular term. Google search index is nothing but the relative percentage of searches done for a particular term across a period of time. The key word here is ‘relative’. It does not show the absolute volume of searches for the term, but the movement in number of searches done for the particular term as percentage of total number of searches done by an average user. The data is normalized such that the highest point in the graph is always 100.
For example, if we search for ‘Hollywood’ in Google Trends, we will obtain the following graph:

An important feature of the tool is that you can compare the Google Search Index of two separate terms. For example, if we compare the terms ‘Hollywood’ and ‘Bollywood’ in Google Trends, the following graph is obtained:

This just shows how much more the term ‘Hollywood’ is searched for in Google relative to ‘Bollywood’ and how the gap has been narrowing over the years.
Another great feature of the tool is that Google Search index may be obtained not only for a particular term, but also related to a particular item. For example, if you type in ‘titanic’ in the Google Trends search box, you have the option to select ‘Titanic (1997 film)’. This basically returns all searches related to the Titanic movie. This helps in filtering out searches which may have been looking for Titanic the ship or other unrelated searches with the same search term.
The basic hypothesis of this article is that the relative Google Search Index of a particular movie has a strong correlation with the ultimate box office performance of the movie. The underlying logic is simple – people generally search for a movie in Google because they are interested in watching the movie, especially in the weekend when the movie is released. For the purpose of this analysis, the Google search index has been taken only for the day succeeding the date of release of the movie. Movies are generally released on Fridays or days preceding a public holiday and as a result, the Google Search Index for the movie is almost without fail the highest on the day after the release of the same.
For our sample set, only the movies released in USA in 2014 have been considered. This has produced a database of around 213 movies released through the year. The box office performance of the movies has been taken from Box Office Mojo, a widely trusted site as far as box office collections are concerned. However, some of the movies throw up no result in Box Office Mojo. This may be combination of a variety of factors, including the fact that some movies are released in direct to video form and some movies have such limited release that their box office numbers are almost negligible. Anyway, around 159 movies have their total box office collections reported in the website. Only these 159 movies have been considered here.
While Box Office Mojo also reports worldwide collection for most movies along with domestic US box office collection, only the domestic numbers have been considered. This is because movies are generally released in different countries on different dates and as a result, the Google Search Index linked to the date of release in USA may not have such a strong correlation with the worldwide revenue of the movie. Considering this, only the Google Search Index for searches within USA on the date succeeding the date of release of a movie has been used as the independent variable for finding the box office returns of the movie.
When you plot the two variables in a scatter plot, the following graph emerges:

Please note that the Google Search Index is a relative number. So, the Search index of ‘300: Rise of an Empire’ on March 08th, 2014 (the movie was released on March 07th, 2014) has been taken as 100 and the Google Search Index for other movies has been taken as relative to that. Thus if the score of ‘The Monuments Men’ is 61, it means the search index for ‘ The Monuments Men’ on 05th Feb, 2014 (the day after its release) was 61% of that of ‘300: Rise of an Empire’ on 08th March, 2014.
If we do a regression analysis with the Google Search Index as the independent variable and the domestic box office receipt as the independent one, we obtain the following results:

The R-square is fairly high at around 75%. It means around 3/4th of the variance of domestic box office receipts of a movie may be explained by the amount of google search volume generated a day after its release. Plus, the p-value of the x variable (Google Search Index) is also very low, indicating that there is a significant relationship between the dependent and the independent variable in this case.
Now to generate more Google searches, you need to have a strong marketing campaign before the launch of a movie in order to feature in the consideration set of more number of potential movie goers. But what other variables may affect the box office outcome of the movie? The critics’ review surely should be one. After all, why would one anyone watch to movie that has been trashed by critics.
Right?
Wrong.
We construct the scatter plot between the tomatometer score of a movie (Rotten tomatoes aggregates the critics’ view of a movie in the form of a tomatometer score which basically indicates the percentage of critics that liked the movie) and the domestic box office performance.

The scatter plot indicates that there is hardly any linear relationship between the box office performance of a movie and its tomatometer score. We further add the tomatometer score as a second independent variable in the regression analysis and obtain the following results:

The addition of the second variable does not improve the adjusted R-square number. Also, the second independent variable has a relatively high p value. Thus we cannot say with 95% confidence that the domestic box office performance has a significant relationship with the tomatometer score of the same.
The result is a poor reflection of the job of the critics. Critics’ views of a movie have little or no predictive power of its eventual box office performance. A case in point is the movie ‘Transformers: Age of Extinction’, one of the highest grosser of the year despite scoring a princely 18% on the tomatometer.
In other words, the performance of a movie at the box office is strongly dependent on the number of potential customers you can reach through a strong marketing campaign (which may include having a stellar, well-known cast, a top notch director, generating pre-release buzz through well made trailers or making sequels to movies which have been hit in the past and is thus well known to a broad swath of the movie going audience) but is hardly influenced by the quality of its content (here, of course I am assuming that the average critics’ score fairly reflects the quality of the movie, an assumption which may only be considered broad at best).
Having the box office data of movies released last year, we can also look at the seasonal pattern in box office performance. Here is the month wise break-up of various statistics related to the movies in 2014:
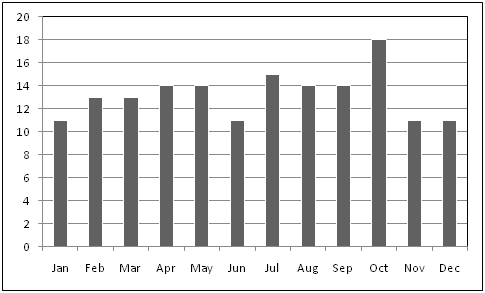
Number of Movies Released:
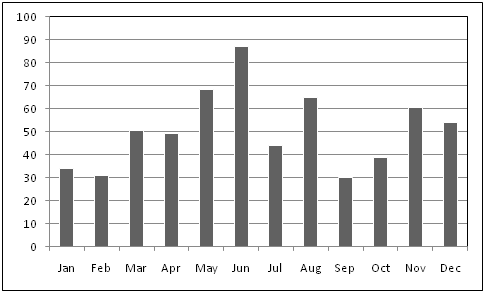
Aggregate Domestic Box Office Performance of Movies Released During the Month (USD Million):

Average Domestic Box Office Performance of a Movie Released During the Month (USD Million)
Average Tomatometer Score:

The above charts tell us a few things:
- January and February are not good months for the show business. Although movies are still released during that period, most such movies are those which could not have been released at any other point in the year. This is reflected in the poor box office performance as well as the below average critics’ rating for movies released in that period.
- The business generally picks up from the month March, with the next three months proving to be among the most lucrative ones. This is because the big studios start coming out with high value summer blockbusters during that period.
- The critics’ score for movies released in summer are not too bad, considering that most of such movies are not made to please critics. However, the score starts really picking up in the last quarter of the year when the movies targeted at the awards season are generally released.
